
Figure 1.
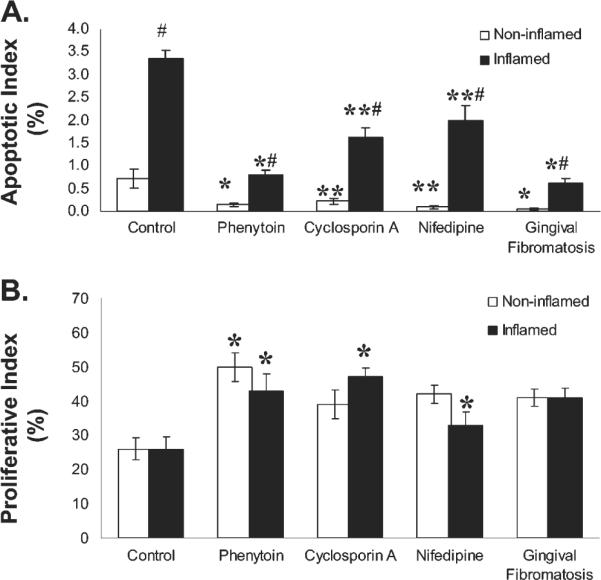
Apoptotic index (% TUNEL-positive fibroblasts) (A) and proliferative index (% PCNA-positive fibroblasts) (B) in gingival overgrowth and control tissue samples. Data are expressed as means ± SD. In (A), the numbers of independent samples (n) per group are: no overgrowth control, 6; phenytoin overgrowth, 8; cyclosporin A overgrowth, 7; nifedipine overgrowth, 7; and gingival fibromatosis, 12. *p < 0.05 compared with control, cyclosporin A, and nifedipine; **p < 0.05 compared with control; #p < 0.05 compared with non-inflamed. In (B), (n) per group is: control, 6; phenytoin, 6; cyclosporin A, 6; nifedipine, 6; gingival and fibromatosis, 12. *p < 0.05 compared with control.