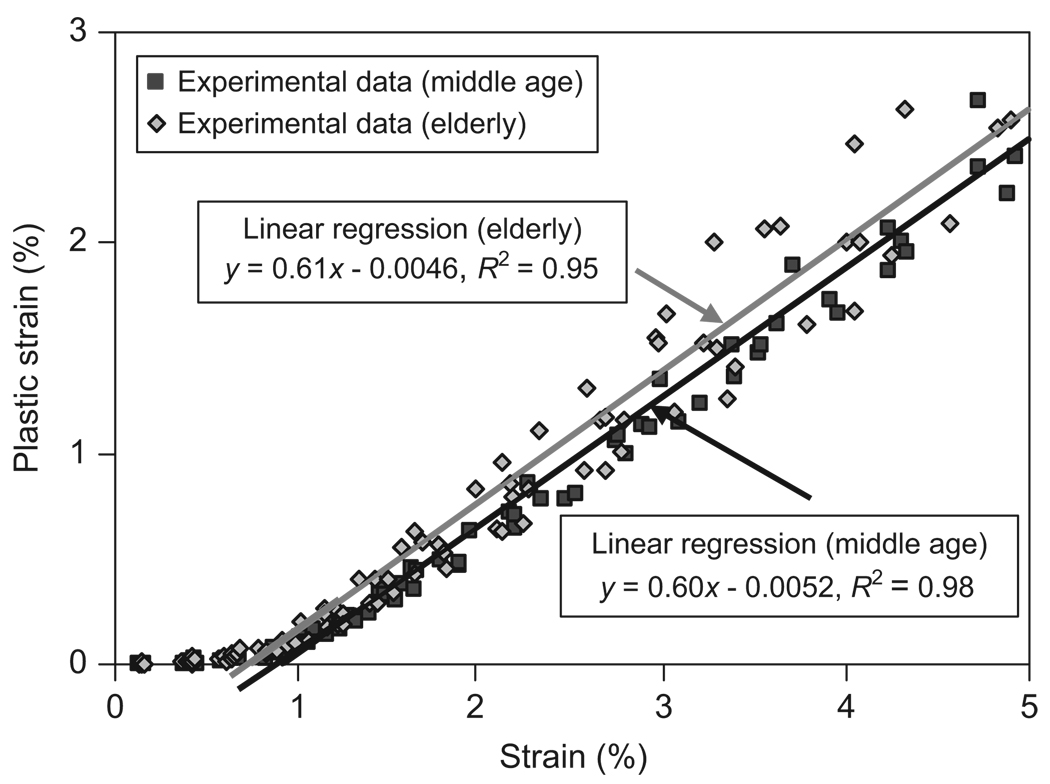
Fig. 7.
Relationship between the plastic strain (εp) and the applied strain (εi) and the linear regression fitting of the linear part of the curves for both middle-aged (εp = 0.60 εi−0.0052, and R2 = 0.98) and elderly groups (εp = 0.61 εi−0.0046, and R2 = 0.95). The yield strain (εy) is determined at the intersection of the regression line with the horizontal axis.

