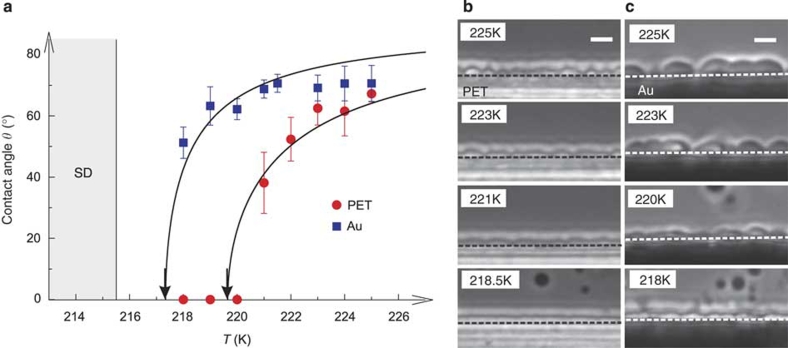
Figure 3. Temperature dependence of the wetting behaviour of liquid II near TSD.
(a) Temperature dependence of θ for PET and gold substrates. Error bars indicate the variance of a number of (about 20) independent measurements of the wetting angle. Curves are the results of the fitting of the following function: θ=cos−1 (At−1), where A=ΔγS/γ0. For PET, A=0.0193±0.0007 and for gold, A=0.0085±0.0007. The wetting transition temperature Tw is estimated as Tw=219.6 K for the PET substrate. θ for the gold substrate also decreases to zero while approaching TSD. For the gold substrate, Tw is estimated as 217 K, slightly above TSD. Phase-contrast microscopy images of the wetting behaviour of liquid II at various temperatures are shown for the PET (b) and gold substrate (c). Scale bars correspond to 10 μm.

