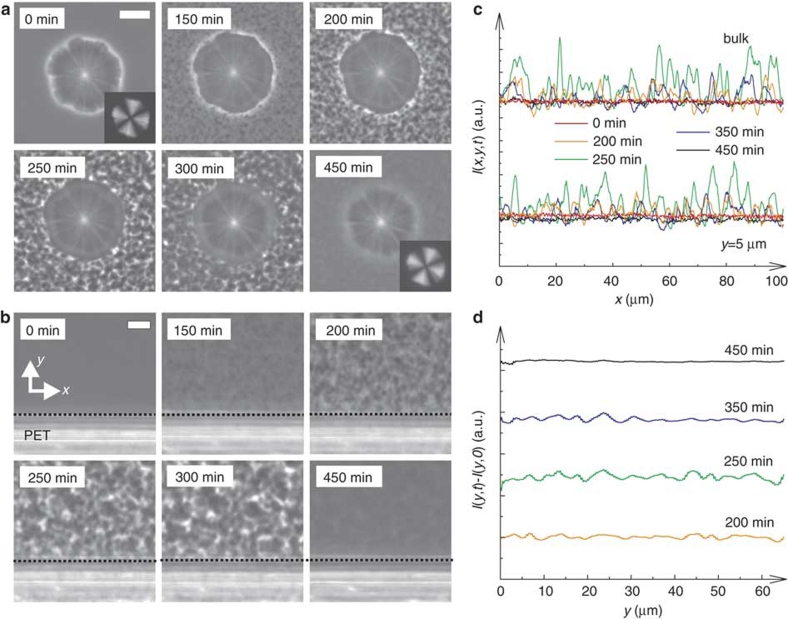
Figure 5. Wetting behaviour for SD-type LLT.
(a) Pattern evolution during SD-type LLT in the presence of a TPP crystal (formed at 235 K), which
is observed with phase-contrast microscopy at 213 K (<TSD).
Insets show the images observed with polarizing microscopy under a crossed Nicols
condition. The white bar corresponds to 20 μm. (b) Pattern evolution during
SD-type LLT in the presence of a PET surface, which is observed with phase-contrast
microscopy at 213 K. The black dotted lines indicate the location of the surface of PET.
The white bar corresponds to 10 μm. For both cases of a and b, the
amplitude of the order parameter fluctuations increases with time initially, but later
decays with time, and finally becomes a homogeneous liquid II state21,22. The characteristic lengthscale of fluctuations keeps increasing with time. We cannot
see any indication of surface-wetting effects on LLT at least on a macroscopic level.
(c) The intensity profile I(x, y, t) obtained from
the micrographs in b, along the x direction at y=5 μm (near
surface) and y=100 μm (in bulk). The PET surface is located at y=0 μm.
(d) The intensity profile in b along the y direction, which is averaged
along the x direction over 100 μm. Here  (L: the length along x). We cannot see any distinct
density profile near the surface (y=0 μm) (for example, a density wave and/or a
wetting layer), suggesting the absence of distinct surface-wetting effects.

