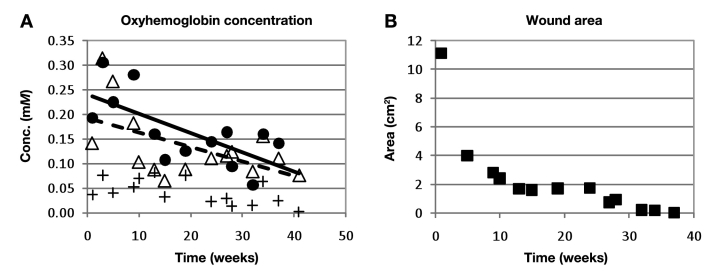
Figure 1.
Example of data obtained from a healing wound that closed after 41 weeks. (A) Oxyhemoglobin concentration as measured by the near infrared device at the wound center (•), wound edge (Δ), and control site on the same limb as the wound (+). The solid line is the linear trend line associated with data obtained from the wound center (slope = –3.9 μM/week); the dashed line is the linear trend line associated with data obtained from the wound edge (slope = –2.9 μM/week). The slopes of both trend lines are negative, as is characteristic of the healing wounds in this study. (B) Wound sizes measured on each day.

