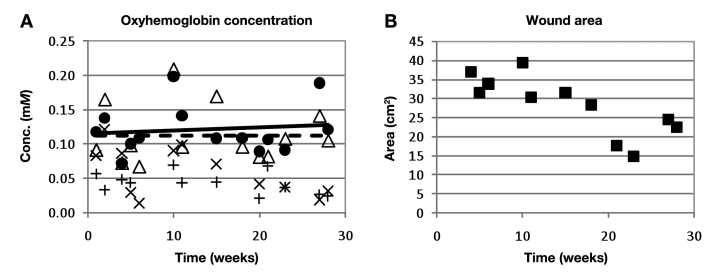
Figure 2.
Example of data obtained from a nonhealing wound that resulted in amputation of the limb after 28 weeks of participation in the study. (A) Oxyhemoglobin concentration as measured by the near infrared device at the wound center (•), wound edge (Δ), control site on the same limb as the wound (+), and control site on the contralateral limb (×). The solid line is the linear trend line associated with data obtained from the wound center (slope = 0.4 μM/week); the dashed line is the linear trend line associated with data obtained from the wound edge (slope = 0.0 μM/week). The slopes of both trend lines are nearly zero or slightly positive, as is characteristic of the nonhealing wounds in this study. (B) Wound sizes measured on each day.

