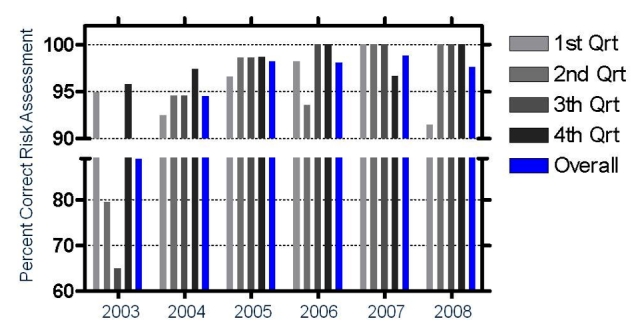
Figure 4.

Composite results from all laboratories in the VQPT program over six years. Each bar shows the percentage of samples for which relative risk was correctly assessed. The last bar in each year shows the average percent correct of the four quarterly challenges for that year.
