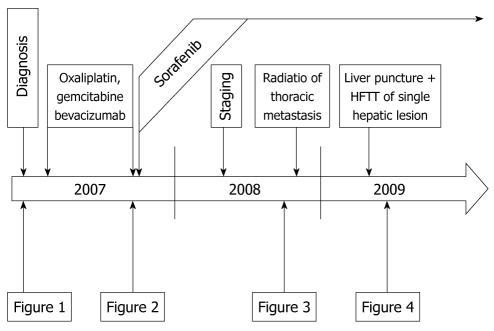
Figure 5.
Schematic course of the disease from diagnosis in early 2007 until late 2009 indicating the time points of therapy and staging examinations. Representative examples are shown in Figures 1 to 4 as indicated here. HFTT: High frequency thermotherapy.

