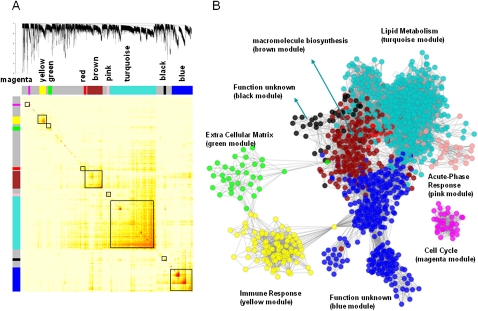
Figure 3.
The HLC coexpression network and corresponding gene modules. (A) A topological overlap matrix of the gene coexpression network consisting of the top 12.5% most differentially expressed genes (5012 expression traits) identifies individual modules (boxed). Genes in the rows and columns are sorted by an agglomerative hierarchical clustering algorithm. The different shades of color signify the strength of the connections between the nodes (from white, signifying not significantly correlated, to red, signifying highly significantly correlated). The hierarchical clustering and the topological overlap matrix strongly indicate highly interconnected subsets of genes (modules). Modules identified are colored along both column and row and are boxed. (B) The corresponding graph of the HLC coexpression network. The colors of the nodes represent their module assignments as described in A. Pathway enrichment terms are assigned to individual modules.

