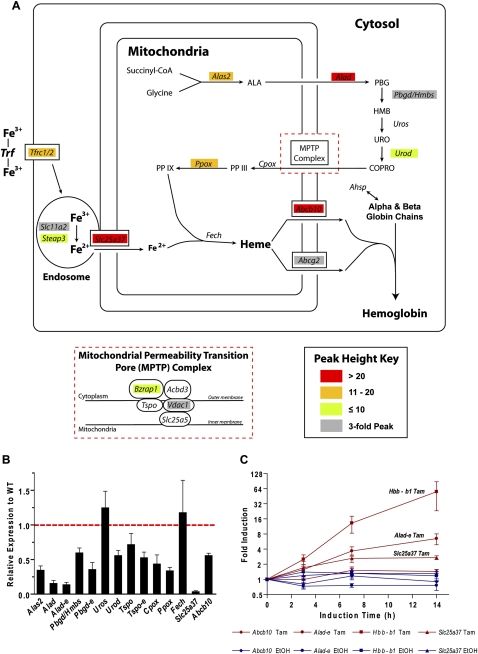
Figure 3.
KLF1 directly regulates synthesis of heme and procurement of iron. (A) Schematic diagram of an erythroid cell simplistically depicting the pathways of heme synthesis, iron procurement, heme export, and hemoglobin assembly. Genes are shown in italics at their point of involvement in the pathways. The components of the mitochondrial permeability transition pore (MPTP) complex are shown in the inset for clarity. Genes in the figure are color coded as shown in the peak height key according to peak height from KLF1 ChIP-seq. (B) Relative gene expression in Klf1−/− fetal liver (compared with WT) for many of the genes depicted in A. Gene expression as determined by qRT-PCR is normalized to the housekeeping gene Hprt and shown for Klf1−/− fetal liver relative to WT (set to 1 as shown by the red dotted line). Data are presented as mean ± SEM. n ≥ 4 in each instance. (C) Relative gene expression in 4-hydroxytamoxifen (Tam)–induced K1-ER cells at 0, 3, 7, and 14 h following induction. Gene expression has been determined by qRT-PCR and normalized to the housekeeping gene Hprt. Induced gene expression (Tam, maroon) is shown together with the corresponding vehicle control (EtOH, blue) on a Log2 scale. Data are presented as mean ± SEM, n = 4.

