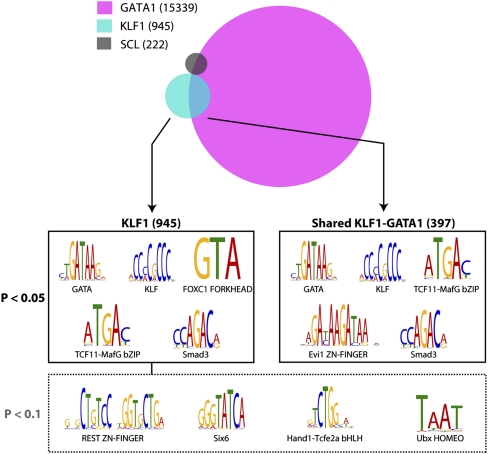
Figure 6.
Analysis of KLF1- and GATA1-bound genomic regions reveals potential interacting transcription factor partners. A schematic representation of the overlap between KLF1, GATA1 (Cheng et al. 2009) and SCL (Wilson et al. 2009) erythroid ChIP-seq datasets defines two major groups of KLF1 binding sites, total binding sites (945), and shared KLF1-GATA1 binding sites (397). Interrogation of binding site sequences using the Clover algorithm identifies the motifs shown as being overrepresented in the groups shown at 0.05 and 0.1 P-value significance levels.

