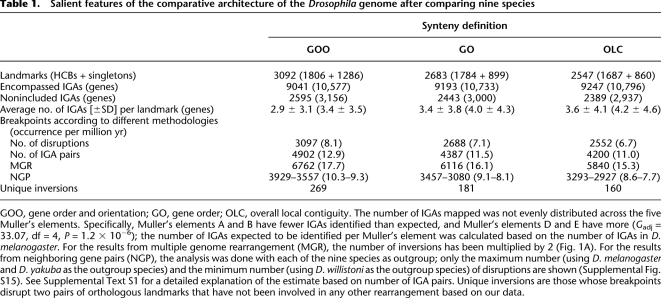
Table 1.
Salient features of the comparative architecture of the Drosophila genome after comparing nine species
GOO, gene order and orientation; GO, gene order; OLC, overall local contiguity. The number of IGAs mapped was not evenly distributed across the five Muller's elements. Specifically, Muller's elements A and B have fewer IGAs identified than expected, and Muller's elements D and E have more (Gadj = 33.07, df = 4, P = 1.2 × 10⁻⁶); the number of IGAs expected to be identified per Muller's element was calculated based on the number of IGAs in D. melanogaster. For the results from multiple genome rearrangement (MGR), the number of inversions has been multiplied by 2 (Fig. 1A). For the results from neighboring gene pairs (NGP), the analysis was done with each of the nine species as outgroup; only the maximum number (using D. melanogaster and D. yakuba as the outgroup species) and the minimum number (using D. willistoni as the outgroup species) of disruptions are shown (Supplemental Fig. S15). See Supplemental Text S1 for a detailed explanation of the estimate based on number of IGA pairs. Unique inversions are those whose breakpoints disrupt two pairs of orthologous landmarks that have not been involved in any other rearrangement based on our data.

