Figure 2.
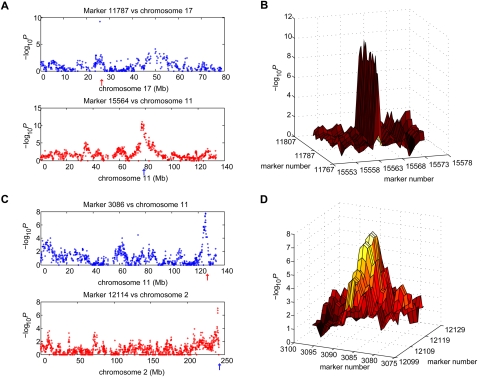
Exclusion and inclusion in G3 data set of candidate interactions. (A) Excluded candidate interaction one marker wide. (Upper panel) Marker 11787 located on chromosome 11 is coretained with a single marker on chromosome 17, marker 15564 (red arrow). (Lower panel) Marker 15564 is coretained with markers on chromosome 11 between 74 Mb and 80 Mb, including marker 11787 (blue arrow). (B) Plot of −log10P for excluded candidate shown in A. Ten markers on each side of markers 11787 and 15564 are displayed. (C) Included interaction. (Upper panel) Marker 3086 on chromosome 2 is co-retained with markers on chromosome 11 between 124 Mb and 128 Mb, including peak marker 12114 (red arrow). (Lower panel) Marker 12114 on chromosome 11 is co-retained with markers on chromosome 2 between 238 Mb and 243 Mb, including peak marker 3086 (blue arrow). (D) Plot of −log10P for interaction shown in (C). Ten markers on each side of markers 3086 and 12114 are displayed.

