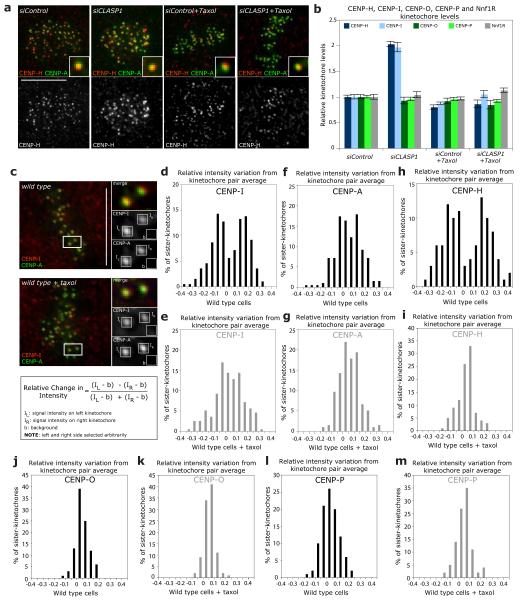
Figure 5.
CENP-H and CENP-I differentially binds to kinetochores attached to growing kinetochore fibres. (a) Representative images of siControl, siCLASP1, siControl+Taxol or siCENP-H+Taxol cells stained with CENP-A antisera (to mark kinetochores; green) and CENP-H antisera (red). Insets show higher magnification views of a single kinetochore. (b) Immunofluorescence quantification of CENP-H, CENP-I, CENP-O, CENP-P and Nnf1R kinetochore levels in cells treated with siControl, siCENP-H, siControl+Taxol or siCENP-H+Taxol RNAs from images such as shown in (a). Error bars represent SEM based on n = 3 independent experiments (c-m) To calculate the asymmetry of the CENP-I (d, e), CENP-A (f, g), CENP-H (h, i), CENP-O (j, k) and CENP-P (I, m) intensities on sister-kinetochore pairs, we determined the intensities of the “left” sister-kinetochore (IL), the “right” sister-kinetochore (IR) and the background value (b) as schematized in (c). If one assumes that x is the average signal intensity of one pair, then the left sister-kinetochore will have an intensity of IL = x + Δ, while the right sister-kinetochore will have an intensity of IR= x - Δ (Δ being the relative positive or negative amount the two sister-kinetochores deviate from the average). By dividing the difference of the background-subtracted intensities over their sum one obtains Δ/x, which indicates by how much the intensity of the left kinetochore is larger or smaller than the average of the two sisters. We then plotted the distribution of Δ/x in cells treated with or without taxol as indicated. A bimodal distribution indicates the existence of two separate sister-kinetochore populations, while a unimodal distribution indicates the absence of protein level asymmetry. Note that CENP-I and CENP-A intensities were measured from the same sister-kinetochores (n = 200 kinetochore pairs for CENP-I and CENP-A; n = 100 kinetochore-pairs for CENP-H, CENP-O and CENP-P). Scale bars = 10 μm.

