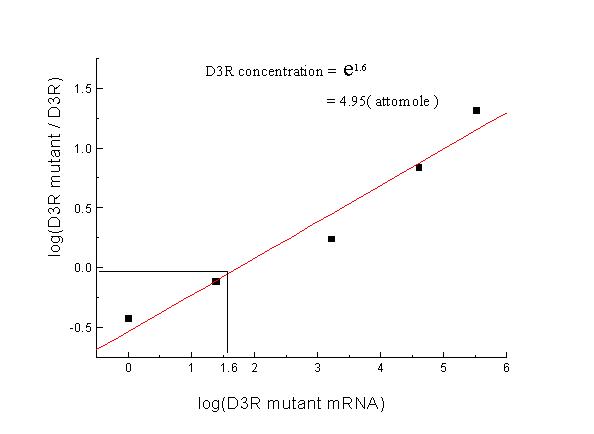
Figure 2.

Analysis of actual D3R mRNA concentraion of Figure 1. The exact concentrations of the patient in Figure 1a. were shown. The 0 point on the Y axis represents equal concentrations of D3R and D3R mutant, and the corresponding point on the X axis represents the actual value of D3R (logarithmic value).
