
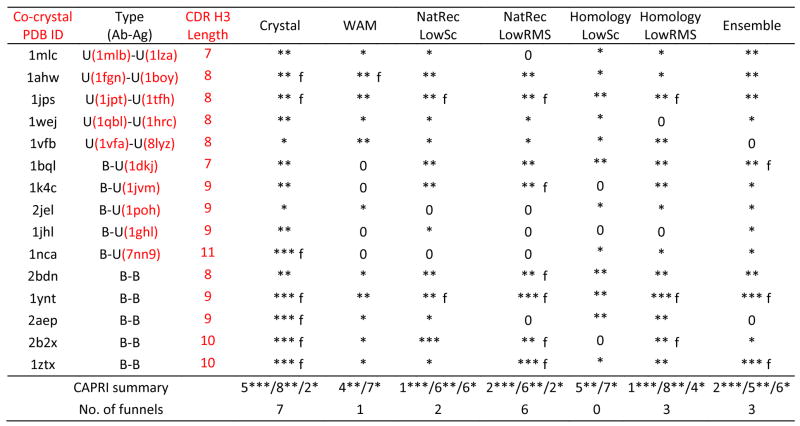
Table III.
Results of antibody-antigen docking simulations. PDB IDs under the “Type” column indicates the unbound component structures when available. Docking runs are annotated as unbound-unbound (U-U), bound-unbound (B-U) or bound-bound (B-B) depending on the use of bound/unbound antibody/antigen crystal coordinates in docking. Crystal indicates docking runs using crystal structure coordinates for both antibody and antigen; WAM indicates docking runs using with the Web Antibody Modeling models built using the web server. NatRec indicates docking runs using the CDR H3 native recovery models, and Homology refers to runs using RosettaAntibody homology models, respectively. For RosettaAntibody runs, results are shown for both the low-score model (LowSc) and the low-rmsd among the ten top-scoring models (LowRMS). Ensemble indicates runs using the ten top-scoring homology models. Three stars (***), two stars (**), one star (*) and “0” indicate that at least one of the ten lowest energy docking decoys is of high, medium, acceptable and incorrect quality respectively, according to the CAPRI definitions.44 Predictions marked “f” additionally exhibit a docking funnel, i.e. five of the ten lowest scoring structures are of medium or high quality. The penultimate row shows the number of targets for which at least one of the ten lowest-energy docking decoy is of high/medium/acceptable quality, and the last row shows the number of targets with a funnel.
 |