
Fig. 4.
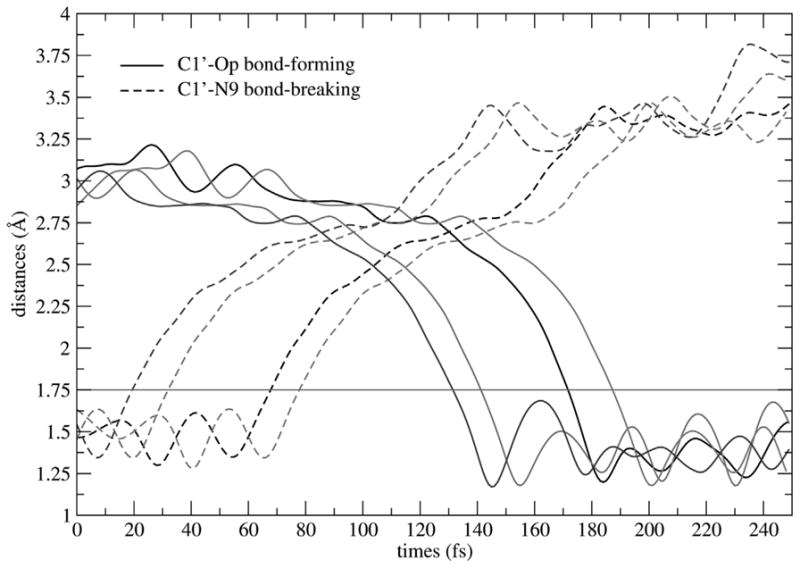
Plot of C1′-N9 bond-breaking (dashed line) and C1′-OP bond-forming (solid line) distances (Å) as a function of time when the chemical reaction proceeds in the direction from reactant (guanosine and phosphate) to product (guanine and ribose 1-phosphate). Four exemplary reactive trajectories taken from the transition path ensemble are shown. The red line is marked at a distance of 1.75 Å; d(C1′−N9) ≤ 1.7 Å defines reactantconfigurations; d(C1′− OP) ≤ 1.8 Å defines product configurations; and transition configurations are defined in between. (Color appears in Web edition.)