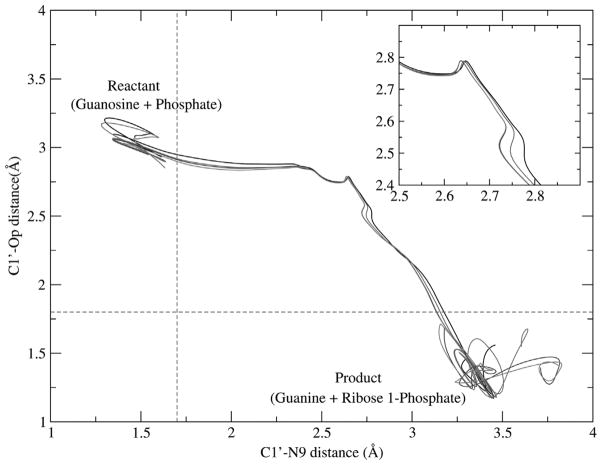
Fig. 5.
Distance of bond-breaking (C1′-N9) is plotted versus distance of bond-forming (C1′-OP) for different reactive trajectories from the transition path ensemble. Reactant and product configurations are defined based on an order parameter definition (the red dashed line). The regions of transition states and ribosyl migration are depicted in the zoom graph. (Color appears in Web edition.)

