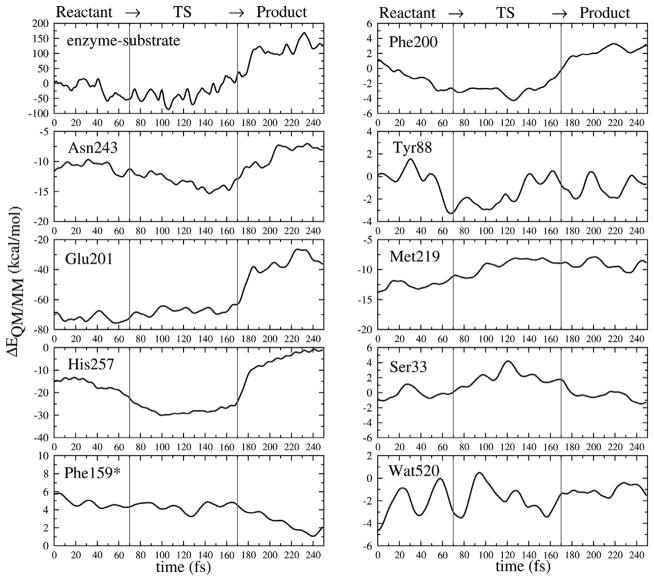
Fig. 8.
Individual active site residue contributions to stabilization and destabilization of the transition state as the reaction proceeds along a single reactive trajectory. This reactive trajectory is divided into the reactant (0–70 fs), transition (70–170 fs), and product (170–250 fs) regions as marked by red lines at 70 fs and 170 fs. (Color appears in Web edition.)

