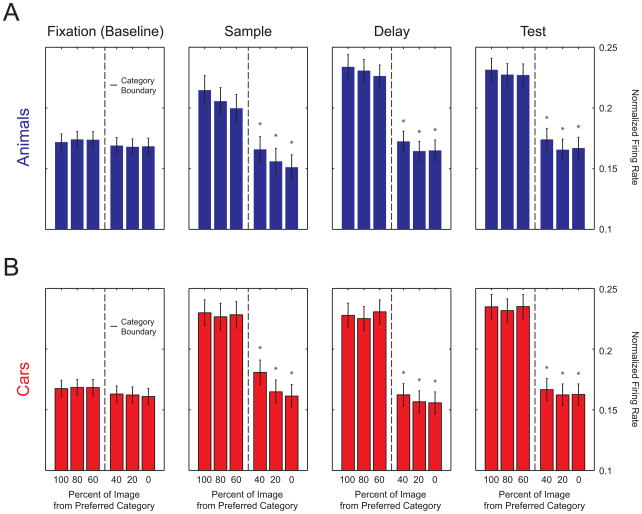
Figure 3. Category Selectivity by Morph Level.
Normalized neuronal firing of category sensitive neurons sorted by the percentage of each neuron’s preferred category that made up the sample image. During fixation (baseline) no category effect is present, but during the sample, delay, and test periods there is a significant difference in firing across the category boundary (but not within). The same hallmark step function as seen in the monkeys’ behavior is seen in the neural population activity. Error bars indicate standard error of the mean. Asterisks indicate that bars were significantly different (t-tests, p < 0.05) from each bar on the opposite side of the category boundary. Bars on the same side of category boundary were never significantly different.

