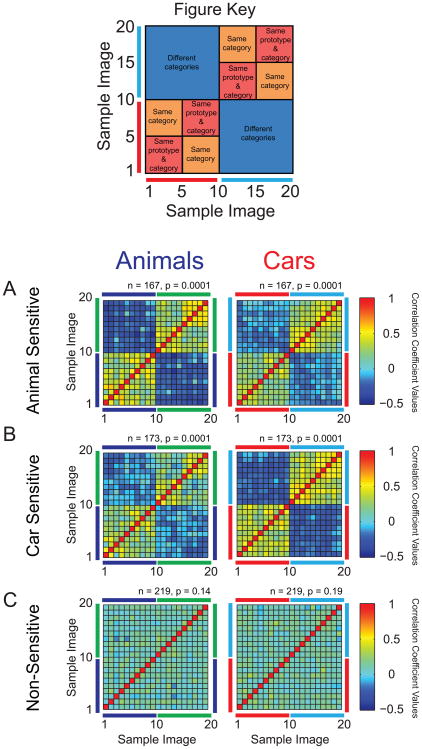
Figure 4. Category Selectivity Across All Images.
Correlations values (r) were computed for all neurons’ mean responses to all possible pairings of sample images from the same category set (images 1–20, either Animals or Cars). Figure Key: Correlation values were then used to define the color of each square in a matrix representing these image pairings. The matrix was arranged such that images 1–10 came from one category (e.g., “Sports Cars”) and images 11–20 came from the opposite category (e.g., “Sedans”). The matrix was further subdivided such that every five images came from the same prototype. A: The average activity of PFC Animal sensitive neurons to images from the same category was highly correlated (similar) - as seen in the warm-colored squares, whereas correlations to images from different categories was negative - deep blue squares. This was true for both the Animal category distinction (left panel) as well as for the Car category distinction (right panel), despite the fact that Car sensitivity was not a factor in selecting the neurons. Thus, Animal sensitive neurons multitask and also convey information about the Car category. B: Car sensitive neurons display strong selectivity to the Car category distinction as well as sensitivity to the Animal category distinction. Again, activity is strongest for the expected distinction (Cars), but clearly evident for the non-selected distinction (Animals) due to multitasking neurons. C: Non-category sensitive neurons had low correlation between the sample images and these correlations were non-significant across categories (between images 1–10 and 11–20). P values indicate significance between categories as determined by permutation tests (see text).

