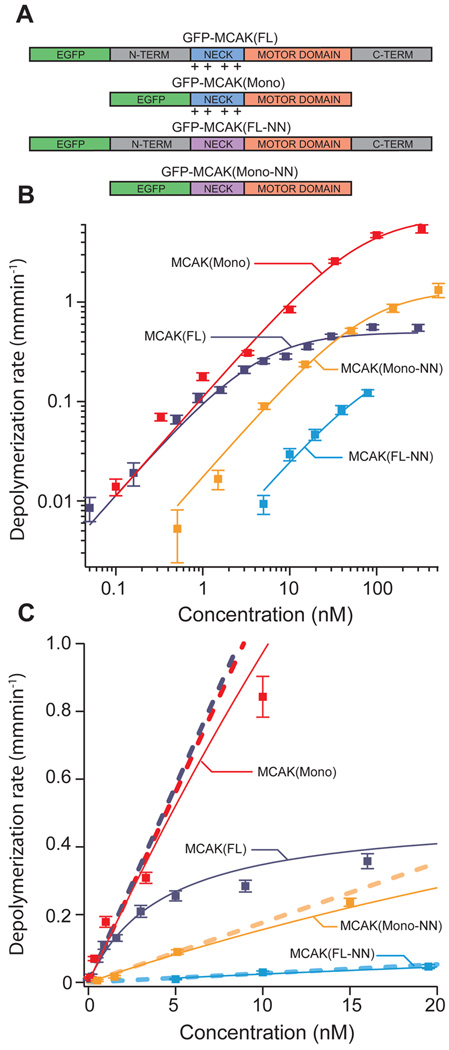
Figure 1. MCAK mutants exhibit shifted microtubule depolymerization dose-response curves.
(A) Diagram of mutated MCAK regions. Wild-type MCAK(FL) consists of the motor domain (orange), a positively charged neck region (blue), and n-terminal and c-terminal domains (grey). MCAK(Mono) is missing both the n-terminal and c-terminal domains, which renders the protein unable to dimerize. MCAK(FL-NN) has several of the positively charged residues in the neck region replaced with neutral alanine residues (purple). MCAK(Mono-NN) combines these mutations. (B) Log-scale plot of average microtubule depolymerization rate vs. MCAK concentration. Data from each of the four MCAK mutants is shown with a Michaelis-Menten fit curve. Error bars reflect s.e.m. values. (C) Linear-scale plot of the same data presented in panel B. The slope of the asymptote (dashed line) associated with each fit curve measures catalytic efficiency (kb). Note: some of the data points at high concentration and/or depolymerization rate land off the scale of the linear plot but are included in the log-scale plot (panel B).

