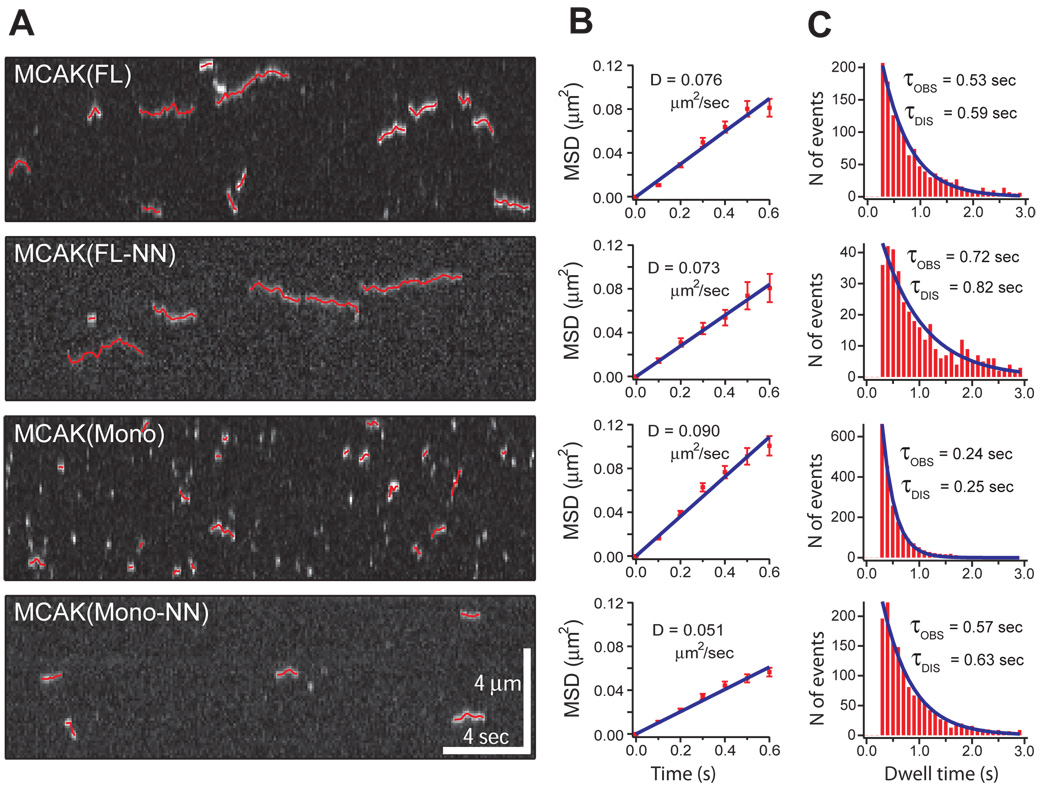
Figure 2. Diffusive behavior of single MCAK molecules and mutants.
(A) Kymographs demonstrate single molecule diffusion of MCAK(FL) and mutant MCAK proteins. All four of the tested MCAK proteins can bind to and diffuse along the microtubule lattice, although with radically different association rates (kON) and dissociation rates (kOFF). 2-dimensional Gaussian fit tracks of the moving spots are overlaid in red. (B) The mean square displacements for each of the four tested MCAK proteins are shown plotted at 0.1 second time intervals. Diffusion coefficients (D) are calculated as the slope/2 of the fit line. (C) Distributions of event dwell times for each of the four tested MCAK proteins shown with a single exponential fit curve. τOBS reflects the observed average event duration. τDIS has been corrected for photobleaching and is thus the average time prior to event dissociation.

