
Figure 5.
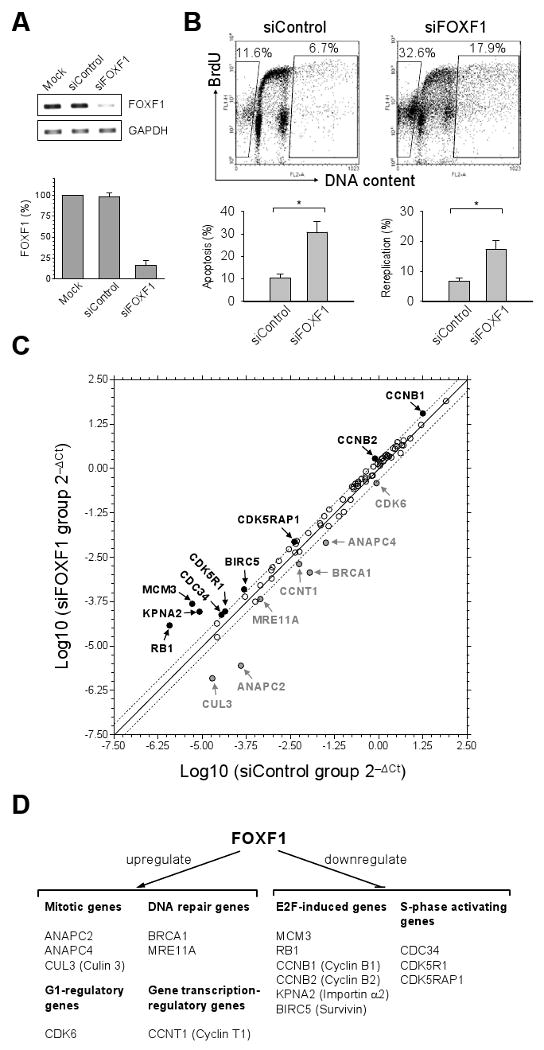
FOXF1 knockdown in cells leads to an increase in DNA rereplication, apoptosis and expression of E2F-induced genes. A, Analysis of the knockdown efficiency of FOXF1 siRNA. Gel-based and real-time-based RT-PCR results are shown on left and right panels, respectively. B, BrdU incorporation analysis of BT549 cells depleted of FOXF1. The FACS 2D dot plot data from BrdU incorporation experiments are shown in the top panel. The percentages of DNA-rereplicated (right gated cells) and apoptotic (left gated cells) cells are shown in 2D dot plots. The statistic bar graph data (mean ± SD) from three independent experiments are shown in the bottom panel. * (p<0.05). C, Expression profiling of cell cycle genes in BT549 cells depleted of FOXF1. The common logarithms of gene expression values from control siRNA-transfected cells were plotted against those from FOXF1 siRNA-transfected cells to make the scatter plot. The up-regulated (≥ 2 folds) and down-regulated (≤ -2 folds) genes in FOXF1 siRNA-transfected BT549 cells were indicated by the black and grey colors, respectively. D, Schematic summary of genes regulated by FOXF1.