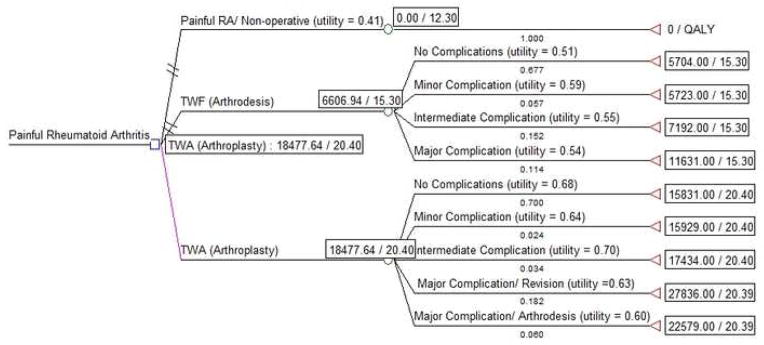
Figure 3.
Cost-utility analysis using utility values derived from patient surveys. This analysis includes the higher cost estimates for each management strategy. The cost/utility ratios shown on the left indicate the overall cost-utility ratio for each procedure. These values are based on the weighted cost of each potential outcome (cost x probability). TWA is the most favorable treatment choice because it is associated with the lowest cost per QALY.

