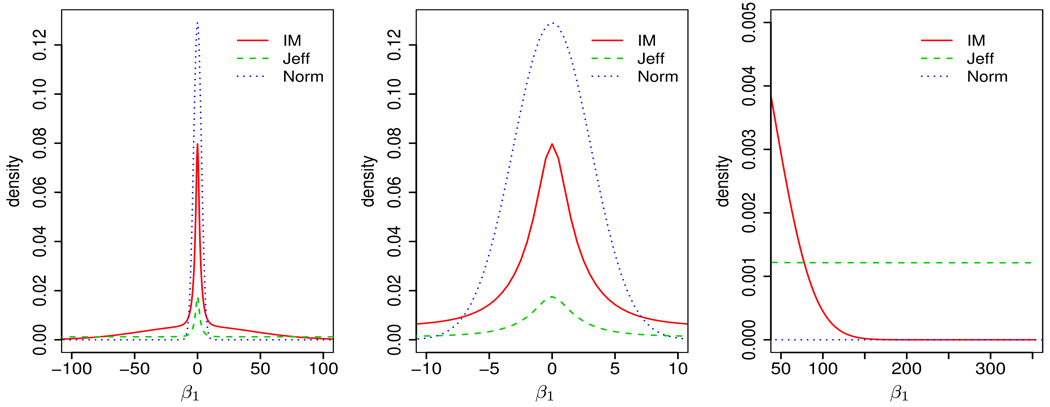
Figure 1.
Density of IM prior under a logistic model with p = 1 compared with Jeffreys’ ( “Jeff”) and a Gaussian prior (“Norm”) for a simulated data set with n = 20. The plot is shown at three different scales. The total density under each curve is the same (normalized); however the Gaussian prior has the highest mass near the center while Jeffreys’ prior has much heavier tails (visible in the third panel). The IM prior has lower mass near the center of the distribution compared to the Gaussian prior but thicker tails; while it has thinner tails and more central mass compared to Jeffreys’ prior.

