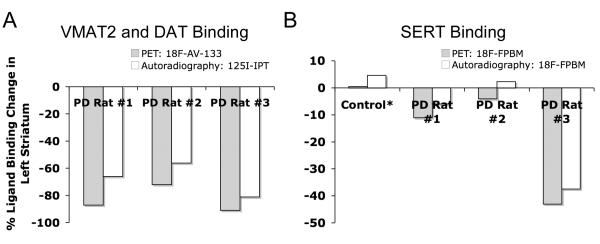
FIGURE 6.
Results from PET imaging and in vitro autoradiography show a similar trend. (A) The results from both PET imaging of VMAT2 with [18F]AV-133 and in vitro autoradiography of dopamine transporters with [125I]IPT suggest that rat #3 had the greatest loss of dopaminergic neurons followed by rat #1 then rat #2. (B) For in vitro autoradiography the percent [18F]FPBM binding reduction was calculated by averaging brain sections containing the rostral striatum (n = 2 for control, n = 3 for rats #1-3). There was variation in values between the brain sections, but the averaged results did rank the rats in the same order of SERT binding loss as the results from PET imaging with [18F]FPBM: rat #3 > rat #1 > rat #2. *Separate control rats were used for PET imaging and in vitro autoradiography.

