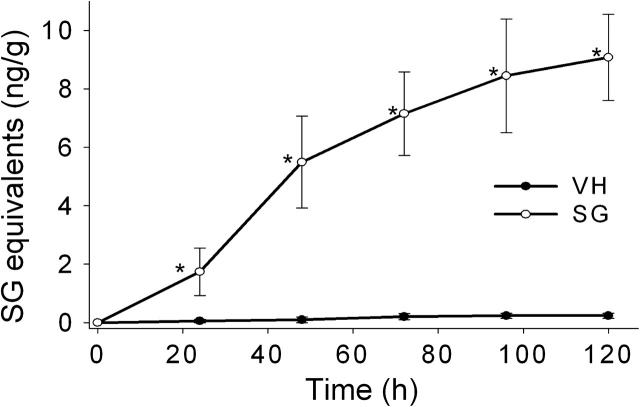
FIG. 6.
Cumulative excretion of SG in urine. Mice were treated with SG as described in Figure 5 legend. Urine was collected in metabolic cages at 24 h intervals, diluted, centrifuged, and supernatants assayed for SG by ELISA. Data are mean ± SEM (n = 4). Asterisks indicate significantly higher than non-SG–exposed mice at corresponding time (p < 0.05).

