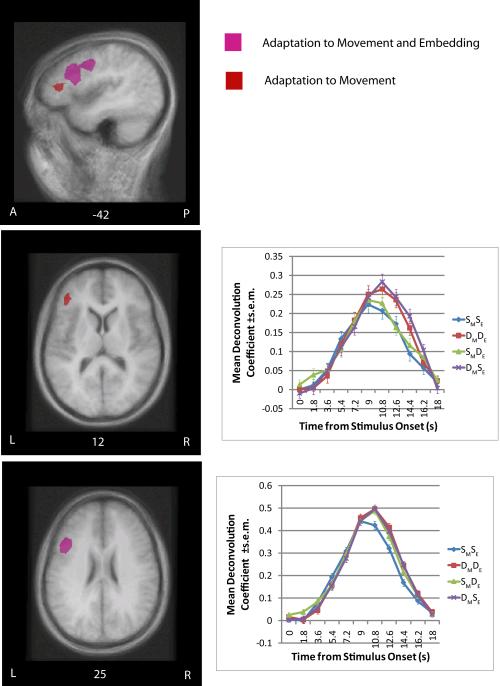
Figure 3.
Presents the clusters of adaptation in the left inferior frontal gyrus (IFG; Broca's area) overlaid on a group average MRI. The anatomical locations are presented sagitally and axially. The pink color corresponds to those areas that adapted to both movement type and embedding position, the red color corresponds to those areas that adapted to movement type only. The clusters are thresholded at equivalent thresholds (p<.05 voxel-wise and p<.05 map corrected for multiple-comparisons). The deconvolution plots for areas that adapted to movement type only and both movement type and embedding position are presented as well.

