Figure 1.
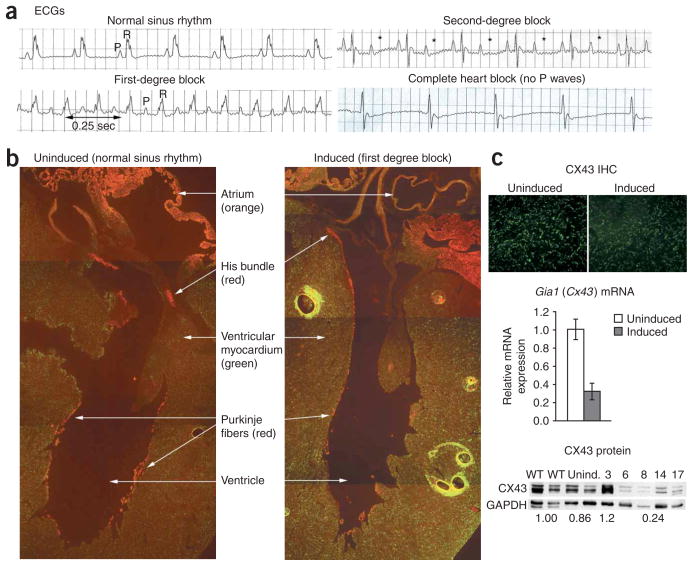
Cardiac conduction abnormalities. (a) ECG abnormalities in induced transgenic mice. P (atrial) and R (ventricular) waves are indicated. * denotes missing R waves in second-degree block. Note the lack of P waves in the complete heart block example. (b) Immuno-histochemistry of a cross-section of mouse hearts, showing CX43 (green), CX40 (red) and CX40 CX43 coexpression (orange). Note the thinning and loss of CX40 staining in the conduction system (Purkinje fibers) of induced mice. (c) CX43 expression is lower in ventricular myocardium of induced mice than in uninduced mice, as detected by immunohistochemistry (IHC), RT-PCR (mean ± s.d.) and protein blotting. Numbers above lanes in protein blot represent the number days of transgene induction. Numbers below lanes represent relative CX43 expression compared to wild-type mice. Numbers below days 6–17 represent the average of those samples. GAPDH was included as a loading control.

