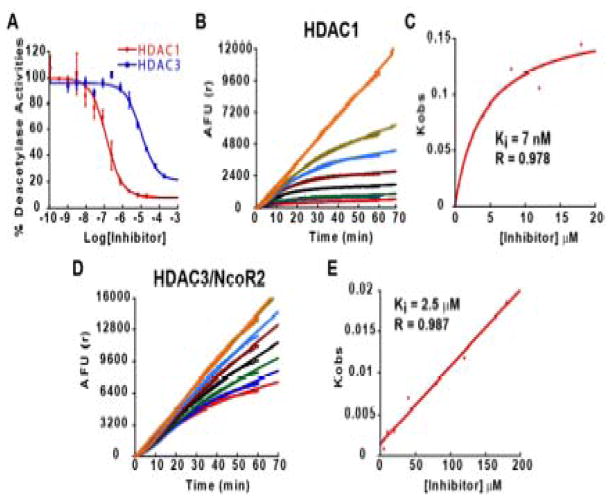
Figure 4.
IC50 and Ki determinations for 3 determined with recombinant HDAC1 or HDAC3/NcoR2. (a) IC50 determinations were performed as described (Chou et al., 2008) with a 1 h pre-incubation of HDAC1 or HDAC3/NcoR2 and inhibitor prior to adding substrate. Enzyme progression curves for HDAC1 (b) or HDAC3/NcoR2 (d) in the presence of increasing concentrations of 3. In panel b, the curves, starting at the top, represent the following final concentrations of inhibitor: no inhibitor, 0.5 μM, 1 μM, 2 μM, 4 μM, 8 μM, 12 μM, and 18 μM. In panel d, the curves represent the following final concentrations of inhibitor: no inhibitor, 5 μM, 10 μM, 20 μM, 40 μM, 80 μM, 120 μM, and 180 μM. Plots of Kobs versus inhibitor concentration for HDAC1 (c) and HDAC3/NcoR2 (e), as in (Chou et al., 2008). For HDAC1, the data are best fit to a slow-on/slow-off inhibition mechanism involving a stable intermediate, while for HDAC3/NcoR2 a simple slow-on/slow-off mechanism provides the best fit to the data. Ki and R values (from the least-squares fit to the data) are shown in the figure, while IC50 values are given in Table 1 (Supplemental material).

