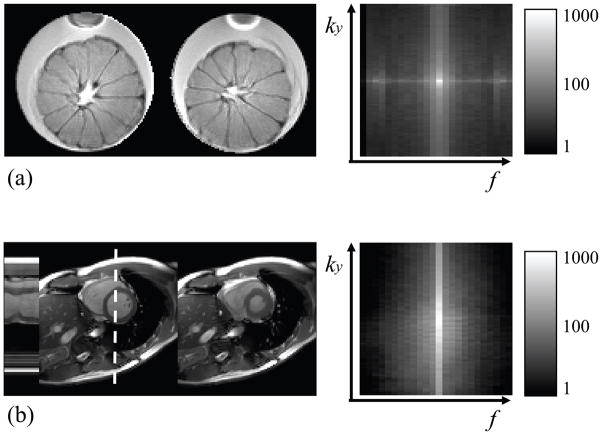
Figure 4.
(a) A phantom dataset with different rotations for different frames and (b) a cardiac cine dataset are displayed here. Temporal changes for the location indicated with a dotted line are plotted on the left, in (b). On the right, the datasets are represented in ky-f space (root sum of mean square along kx). As could be expected, much of the signal resides near the spatial and temporal DC region.

