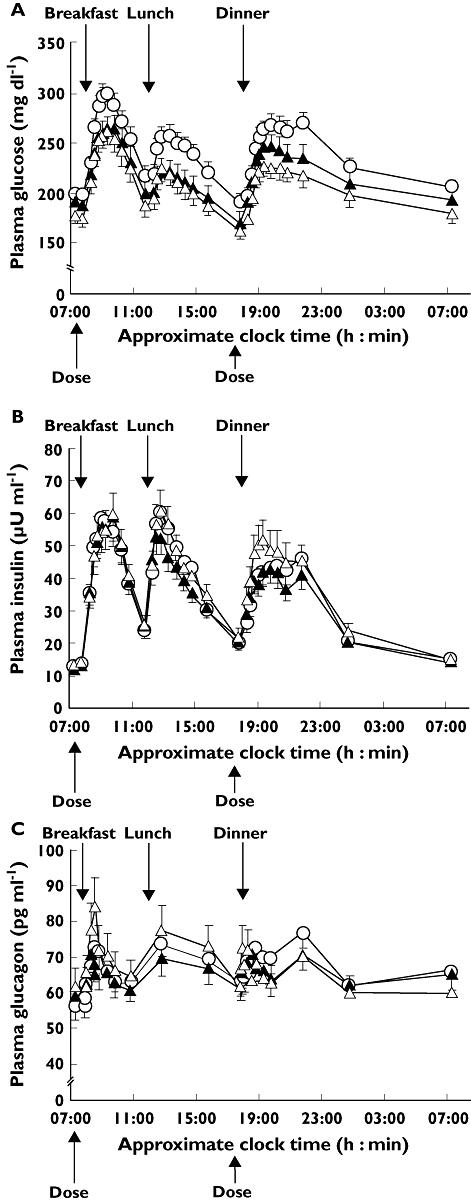
Figure 3.

Mean plasma concentration–time profiles for A) glucose, B) insulin and C) glucagon after 28 days of morning (n = 38) or evening (n = 38) administration of vildagliptin 100 mg, and during the placebo run-in (n = 45). Data are mean ± SEM. Run-in ( ); Morning dose (
 ); Evening dose (
 )
)
