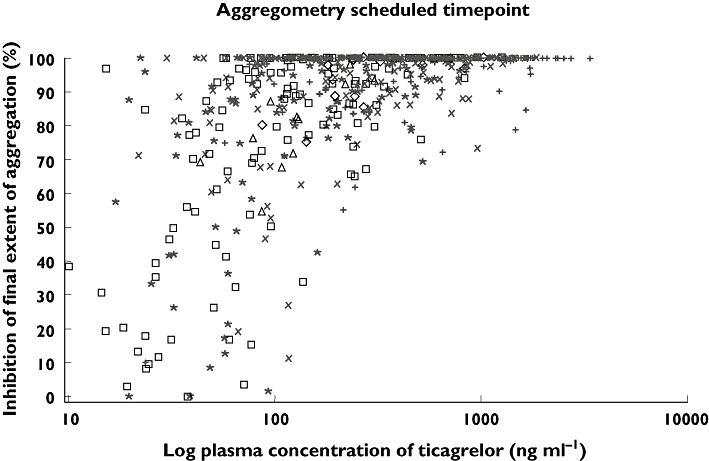
Figure 6.

Effect of log ticagrelor plasma concentration on % IPA (final extent, 20 µm ADP). Data shown over a restricted plasma concentration range (0–1000 ng ml−1); key shows actual time (post-dose) of aggregometry measurement. 4 h (+); 8 h (×); 12 h (*); 24 h (□); 36 h (◊); 48 h (▵)
