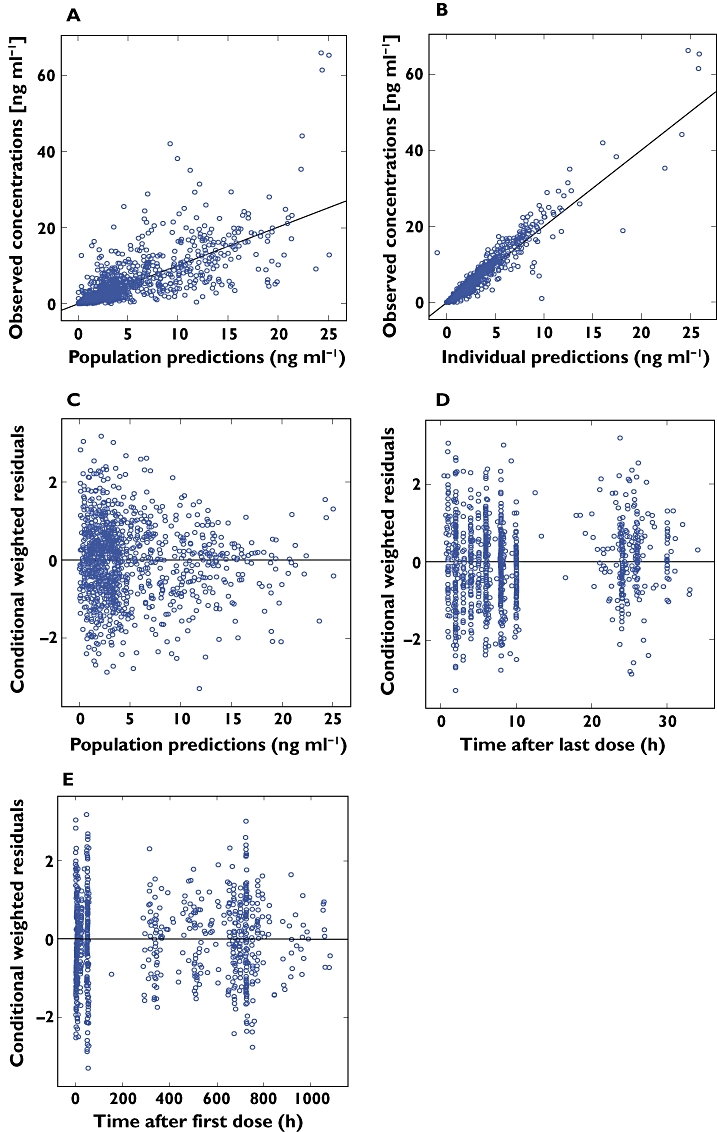
Figure 1.

Goodness-of-fit plots for the final population model. (A) observed vs. population predicted concentrations; (B) observed vs. individual predicted concentrations. The solid line represents the line of identity. (C) conditional weighted residuals vs. population predicted concentration; (D) conditional weighted residuals vs. time after last dose; (E) conditional weighted residuals vs. time after first dose
