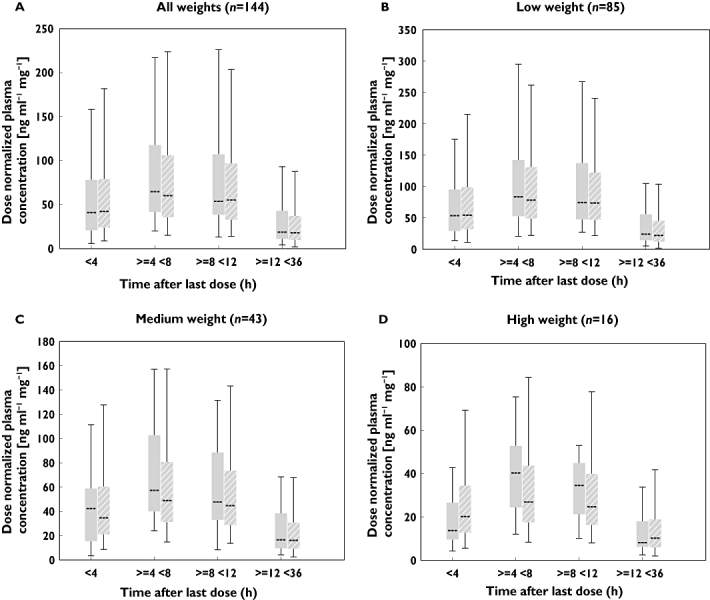
Figure 2.

Model qualification using visual predictive check. Plots contain the box and whisker plots of time intervals of observed concentrations and predicted concentrations from the final model at steady-state. Evaluation was performed for (A) all patients, (B) low weight patients (12.1–25.0 kg), (C) medium weight patients (25.1–50.0 kg) and (D) high weight patients (50.1–100.0 kg). Box = 25 and 75th percentile, whisker = 95th and 5th percentile. Observed ( ); Final model (
 )
)
