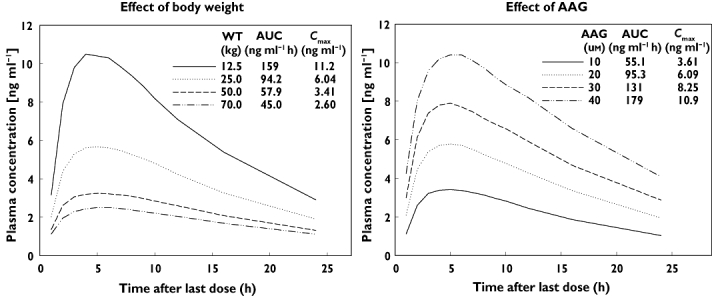
Figure 4.

Simulation to visualize the effect of covariates in the final model. Simulation was performed 1000 times. The dose was fixed at 0.1 mg. The left panel shows the median plasma concentrations and pharmacokinetic parameters for patients with different body weights. AAG was fixed at the median value of 20.0 µm. The right panel shows those for the patients with different AAG concentrations. Body weight was fixed at the median value of 25.0 kg
