
Figure 1. The synaptic TRFs shortly after the hearing onset.
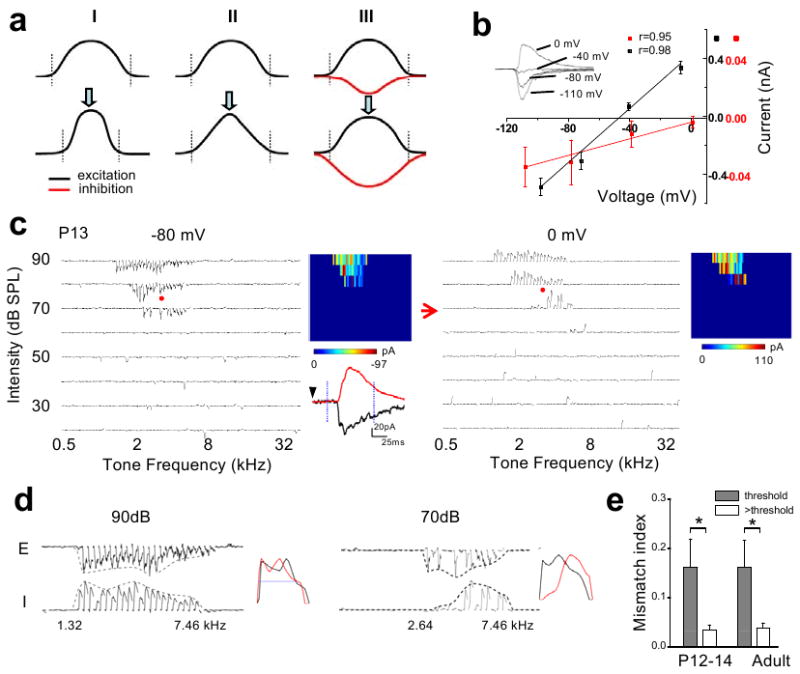
a, Three synaptic models for the functional refinement of sensory spike RFs (reduction in the size of RFs). Curves represent tuning profiles of excitation (black) and inhibition (red) along a sensory space. A pair of dotted vertical lines indicate the total responding range of excitatory inputs. I, pruning of peripheral excitatory inputs (i.e. reduced total responding range). II, adjustment of input strengths without pruning of inputs. III, broadening and strengthening of cortical inhibition. b, I-V curves for a recorded A1 neuron. Inset, average traces of synaptic currents (five repeats) of the neuron evoked by a noise stimulus. Average amplitude was measured within the 1–2ms (red) and 21–22ms (black) windows after the onset of the average synaptic response recorded at -80 mV. Correlation coefficient (r) is shown. c, TRFs of excitatory and inhibitory inputs for an example P13 neuron. Arrays of traces depict the excitatory (-80mV) and inhibitory (0mV) currents evoked by individual tone stimuli at various frequencies and intensities. Red arrow marks the intensity threshold. Color map depicts the peak amplitudes of tone-evoked synaptic currents within the TRF. The example excitatory (black) and inhibitory (red) responses evoked by the same tone (indicated by red dots) were enlarged. Dotted vertical lines mark the 75-ms window for plotting individual small traces in the array. d, Frequency tuning curves of excitatory (E) and inhibitory (I) inputs to the same cell as in b at two intensities: the threshold (70dB) and 20 dB above the threshold (90dB). The starting and ending responding frequencies for the inhibitory tuning were marked. Right, the tuning curves are normalized and superimposed (E, black, reversed in polarity). Blue line indicates the half-peak level. e, Mismatch indices at threshold intensity (grey) and intensity of 20dB above threshold (white). For two P12–14 cells exhibiting an intensity threshold of 80 dB SPL, MMI was derived at 10dB above the threshold. *: p < 0.005, paired t-test, n = 8, 6 for P12–14 and adult, respectively. Error bar = s.d.