
Figure 4. Synaptic mechanisms underlying the developmental refinement of spike TRFs in A1.
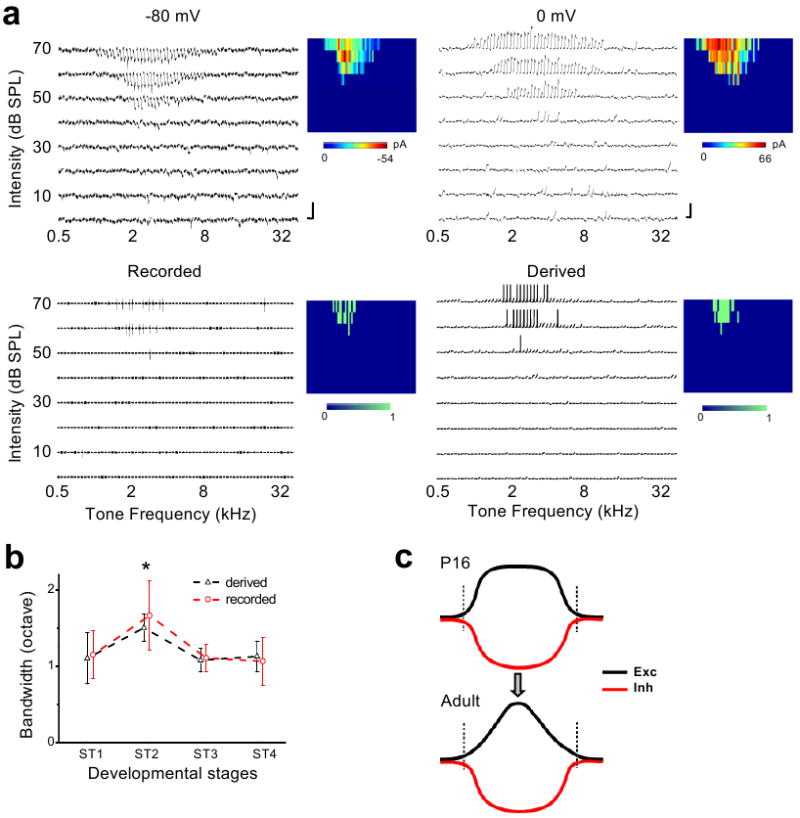
a, An example cell with cell-attached recording followed by whole-cell recording. Top panels, the excitatory (-80mV) and inhibitory (0mV) TRFs of the cell. Scale: 50 pA and 100ms. Bottom left, the recorded spike TRF. Bottom right, the TRF of derived membrane potential and spike responses. Color maps represent the peak amplitudes of synaptic inputs (top), and number of spikes evoked (bottom). b, Bandwidths of spike TRFs derived and recorded from cells at different stages. Bandwidth was measured at 10dB above threshold. The value at ST2 is significantly higher (p = 0.1, 0.024, 0.014 between pairs of ST2-ST1, ST2-ST3 and ST2-ST4 respectively for recorded TRFs, n = 7, 11, 6, 14; p = 0.004, 0.016, 0.015 for derived TRFs, n = 8, 8, 5, 6, ANOVA with post hoc). Error bars = s.d. c, A developmental model. The excitatory (Exc) tuning profile is developmentally sharpened while the inhibitory (Inh) tuning remains relatively stable. Vertical lines mark the total range of inputs.