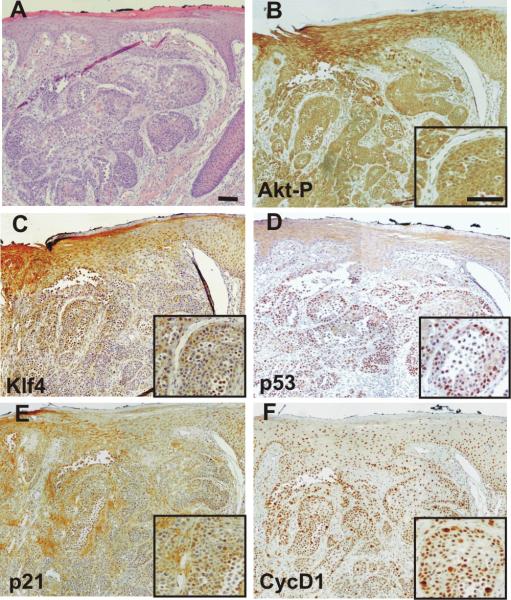
Figure 3. Analyses of KLF4-related pathways in HNSCC.
A, Example of hematoxylin-eosin-stained section of human oral SCC. B–F, Consecutive sections stained for phosphorylated Akt (B), KLF4 (C), p53 (D), p21 (E) and cyclin D1 (F). Insets in B, C, D, E, F denote the same area of the tumor at higher magnification. Bars =200 μm.

