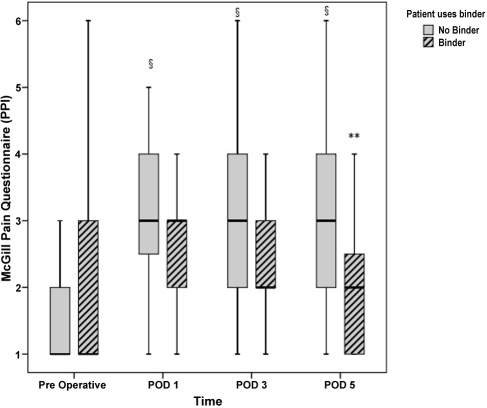
Figure 2.
Box plot distribution for the short-form McGill Pain Questionnaire, present pain intensity (PPI) before and after surgery: bold solid box line is median, top of box is upper quartile (QU 75%), bottom of box is lower quartile (QL 25%), and whiskers correspond to inner fences. Upper and lower inner fences are drawn to the “outermost” observed data points within one step (1.5×the interquartile (QU—QL) range) above QU 75% and below QL 25% respectively. Binder group medians: preoperative=1, POD 1=3, POD 3=2; no binder group medians: preoperative=1. §p<0.001 PODs 1, 3, 5 versus preoperative; **p<0.01 binder versus no binder

