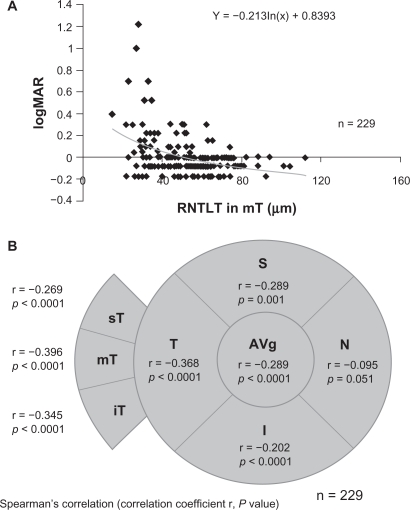
Figure 1.
Coefficient of correlations (r) between the BCVA and the RNFLT in different regions of the optic disc. A) Scatterplot graph showing the association between logMAR BCVA and the RNFLT in the mT sector. B) Diagram illustrating the relationship between the visual field location and the BCVA/RNFLT correlation data. Upper line, correlation coefficient value (r); and lower line, P value. Statistical analysis was performed by Spearman’s correlation. Average overall RNFLT; S, superior quadrant; T, temporal quadrant; I, inferior quadrant; and N, nasal quadrant. The temporal RNFLT was divided into 3 sectors of 30°; sT, superiotemporal sector; mT, midtemporal sector; iT, inferotemporal sector.

