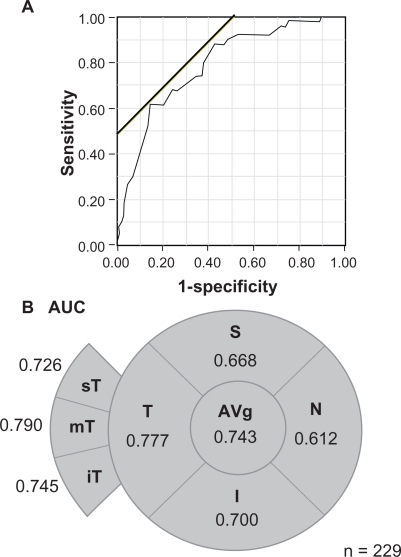
Figure 2.
Visual field regional values of area under curve (AUC) of the receiver operating characteristics between RNFLT and visual acuity. A) ROC plot shows the association between logMAR BCVA and RNFLT in the mT sectors. The oblique line is the cut-off values. B) AUC data displayed as a function of visual field location. Average overall RNFLT; S, superior quadrant; T, temporal quadrant; I, inferior quadrant; and N, nasal quadrant. The temporal RNFLT was divided into 3 sectors of 30°; sT, superiotemporal sector; mT, midtemporal sector; and iT, inferotemporal sector.

