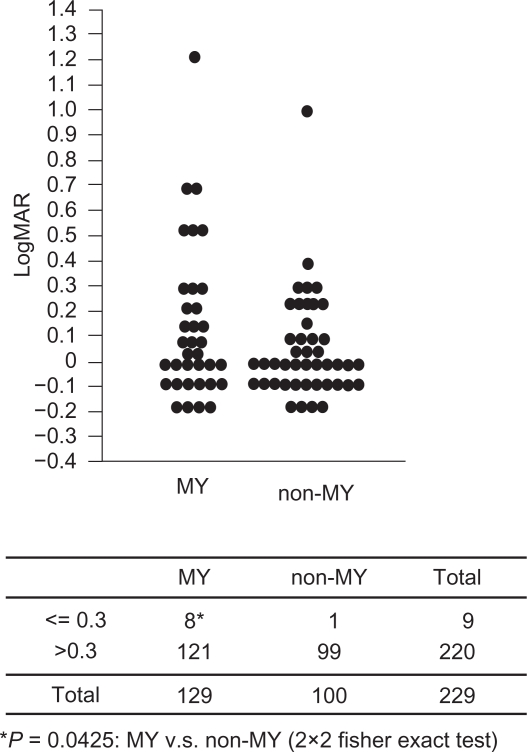
Figure 3.
LogMAR best corrected visual acuity (BCVA) between the patients with the MY disc type and the non-MY disc type. A) Dot blot shows the distribution of logMAR BCVA in the MY and non-MY disc types. B) The Fisher exact probability test based on the tabulated data indicates that there are more patients with low BCVA (0.3 or less) in the MY disc types than in the non-MY disc types.

