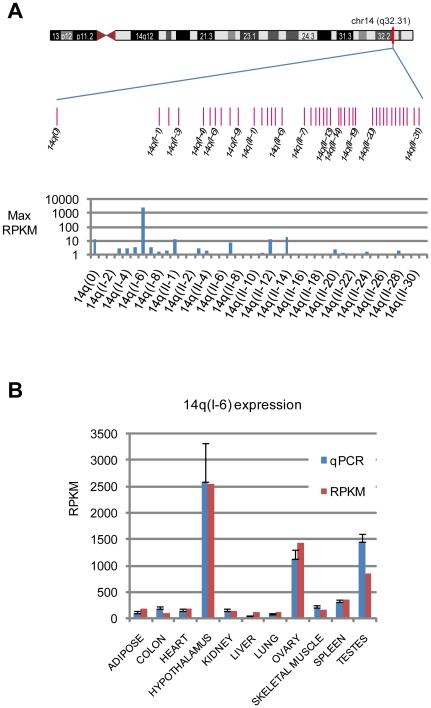
Figure 3. Expression of the 14q snoRNA cluster.
A: genomic layout of the 41 members of the 14q snoRNA cluster (upper) and maximum RPKM values for each member, across all tissues (lower). Every second snoRNA is labeled. Y-axis is log10 scale. B: expression of the highly expressed 14q(I-6) snoRNA. qPCR values are normalized to 18S and the mean sequencing value. Y-axis is linear scale.

