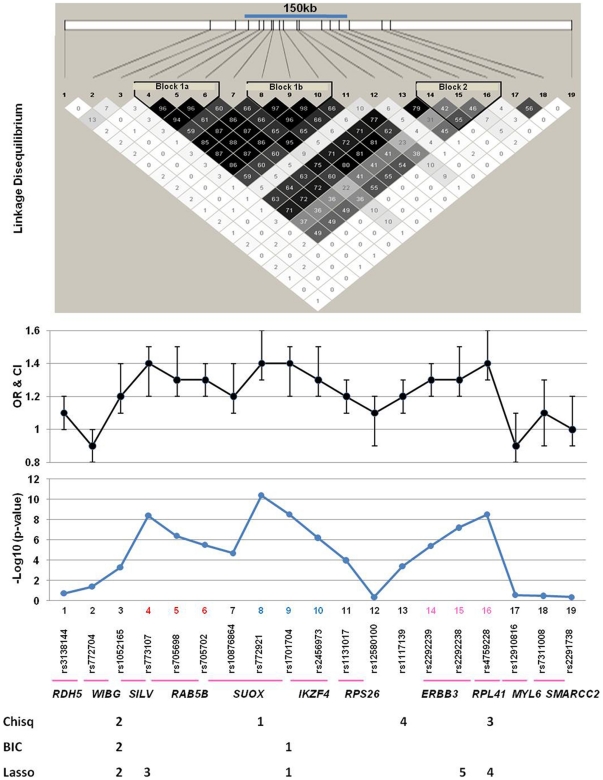
Figure 1. T1D is significantly associated with SNPs in the 12q13 region.
Shown are LD map (top), odds ratios and 95% confidence interval (OR and CI), and −Log 10 p-values. The 150-kb region defined by SNP #4 and #16 showed some LD as indicated by the R2 values between pairs of SNPs. Three LD sub-blocks were identified by the HaploView 4.1 program, although there is strong LD throughout the region. The numbers below the SNPs indicate the relative importance of SNPs based on analyses aimed at determining independent effects. For the chi-square and BIC based analyses, the numbers indicate the order in which the SNP was entered in stepwise analyses. For the Lasso analysis, the number indicates the relative size of the estimated coefficient in the final model.

