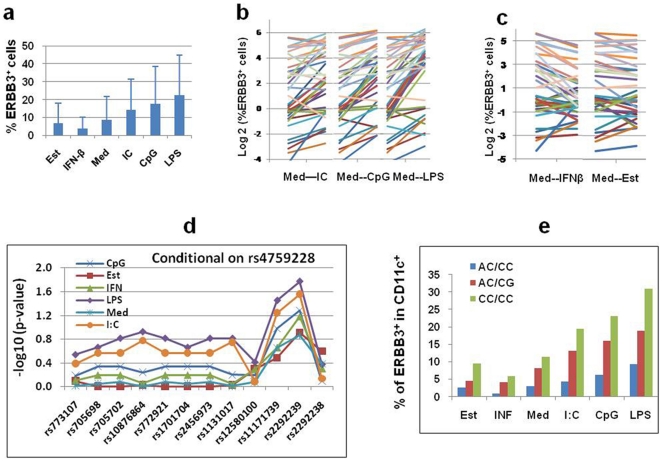
Figure 4. Surface ERBB3 expression depends on the types of stimulation and SNP genotypes.
(a) Mean percentage of ERBB3+ cells among CD11c+ PBMCs after culture with medium alone (Med) or different stimulation: Est (estrogen), IFN-β, IC (polyI:C), CpG and LPS. (b) Inter-individual variation of percentage of ERBB3+ cells among CD11c+ PBMCs after stimulation. Data were Log 2 transformed. Data points for cultures with medium alone (Med) and one stimulation (IC, CpG or LPS) in each individual were linked to illustrate the changes in ERBB3 under different culture conditions. (c) The impact of IFN-β and estrogen on ERBB3 expression. The data are presented in similar ways as in (b). (d) The association between percent of ERBB3+ cells in CD11c+ PBMCs and SNP pairs. Regression was used to examine whether two SNPs could improve the association between % of ERBB3+ cells and genotype. The −Log10 p-value for each SNP added to a model that already included SNP rs4759228 was plotted against the genomic order of the SNPs. These results indicate that the percentages of ERBB3+ cells are partially determined by genotypes within/near the ERBB3 gene. (e) Mean percentages of ERBB3+ cells were presented according to culture conditions and two-locus genotypes at rs2292239 and rs4759228.

