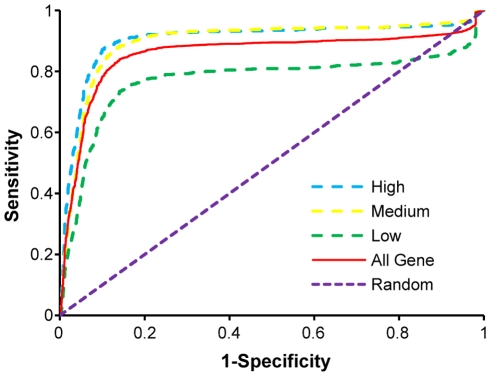
Figure 1. ROC curve for TSS prediction of protein coding genes.
The expressed genes were separated into three categories, high (light blue), low (green), and medium expressed genes (yellow). The three categories of expressed genes and non-expressed genes are considered positive and negative sets, respectively. One fourth of the genes are used as training data, while the remaining are used as the test set. The ROC curve was generated using ROCR library in R project (http://www.r-project.org).

