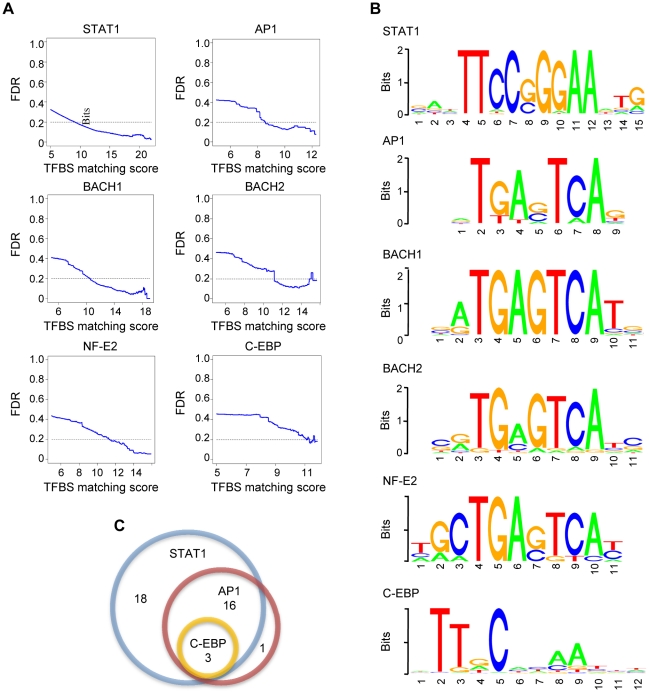
Figure 4. Identification of collaborating transcription factors.
(A) Enriched motifs in STAT1 binding regions. The y axes demonstrate the ratio of the number of specific binding in randomly selected promoter sequences (1,000-bp upstream transcription start site of the genes that are not STAT1 targets) and the sequences in ChIP-enriched regions; this number can also be considered as false discovery rate (FDR) at different matching scores (represented by x axes). (B) Sequence logos of enriched motifs. The size of the letter indicates the information content of that nucleotide position. (C) Number of microRNAs whose predicted promoter regions overlap with STAT1-enriched regions that contain putative binding sites of STAT1, AP-1, and C/EBP.

