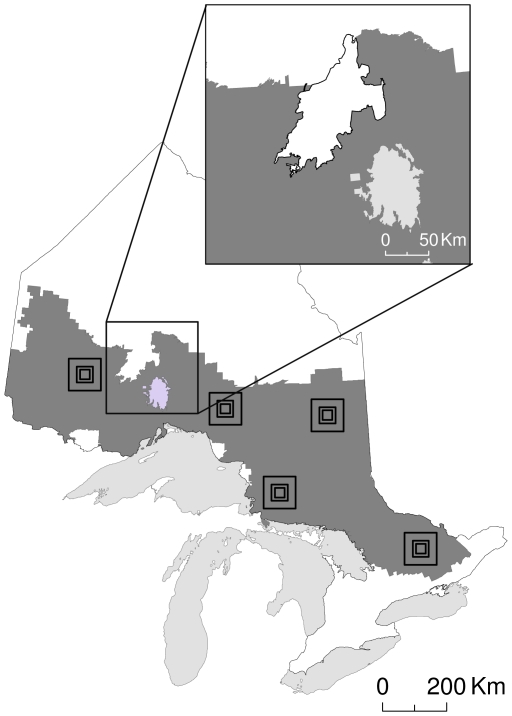
Figure 1. A map of Ontario, Canada.
Dark grey depicts where detailed land-cover data exist in the province (forest resource inventory [FRI]). The boundaries of the dark grey area are “artificial” (except where bounded by water [light grey]), in that these boundaries exist because of a lack of data outside of the dark grey area; on the ground, habitat continues beyond these edges (white area). The inset map shows Wabakimi Provincial Park in Ontario (black outline), where we do not have FRI data but we know that the area contains suitable habitat. Models of gene flow across this region would attribute unrealistically high resistance to the habitat between the lake and the Park, while real organisms on the ground would be able to traverse the Park and surrounding habitat. Outlines of the 5 plots are shown.

